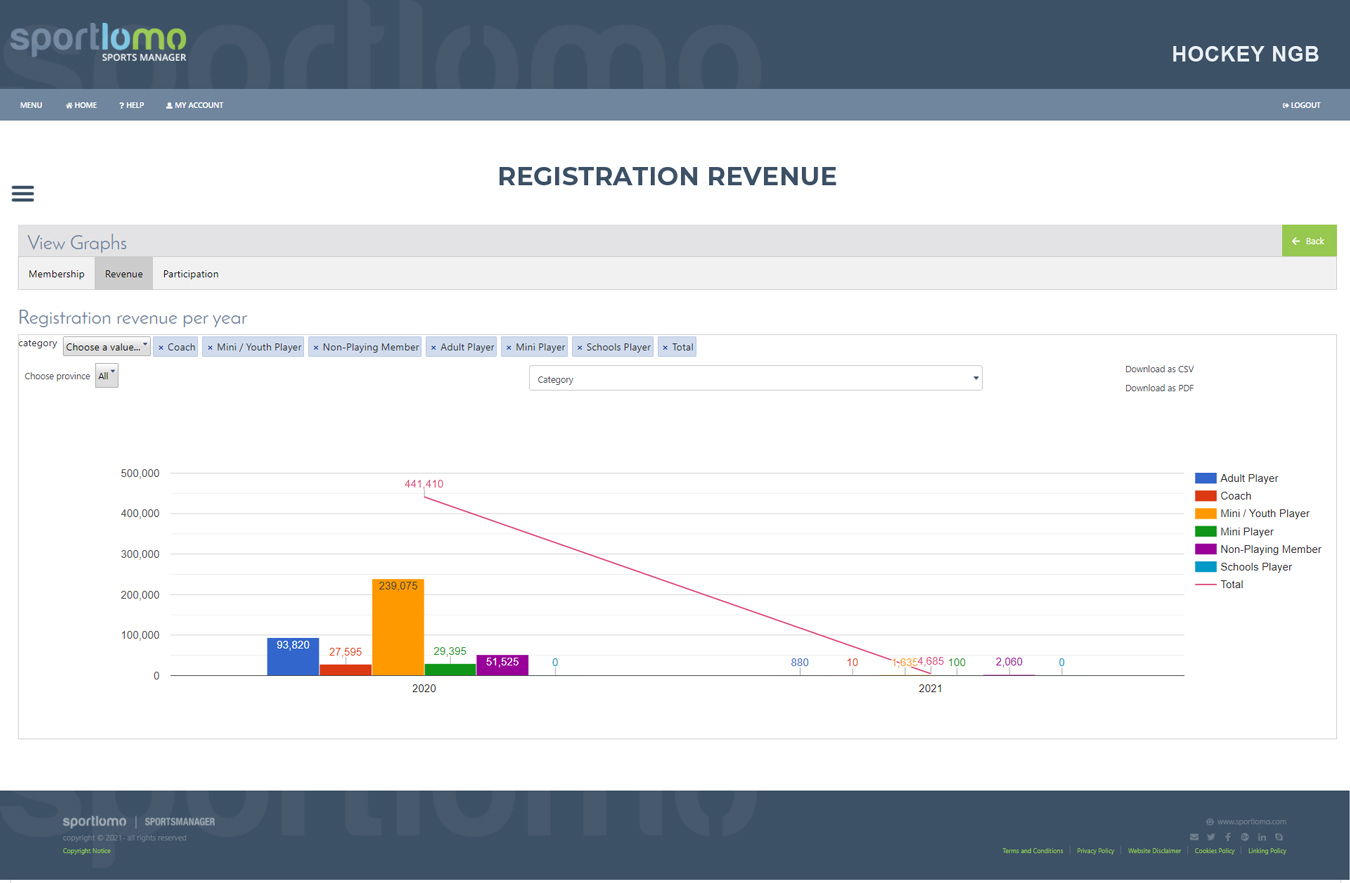
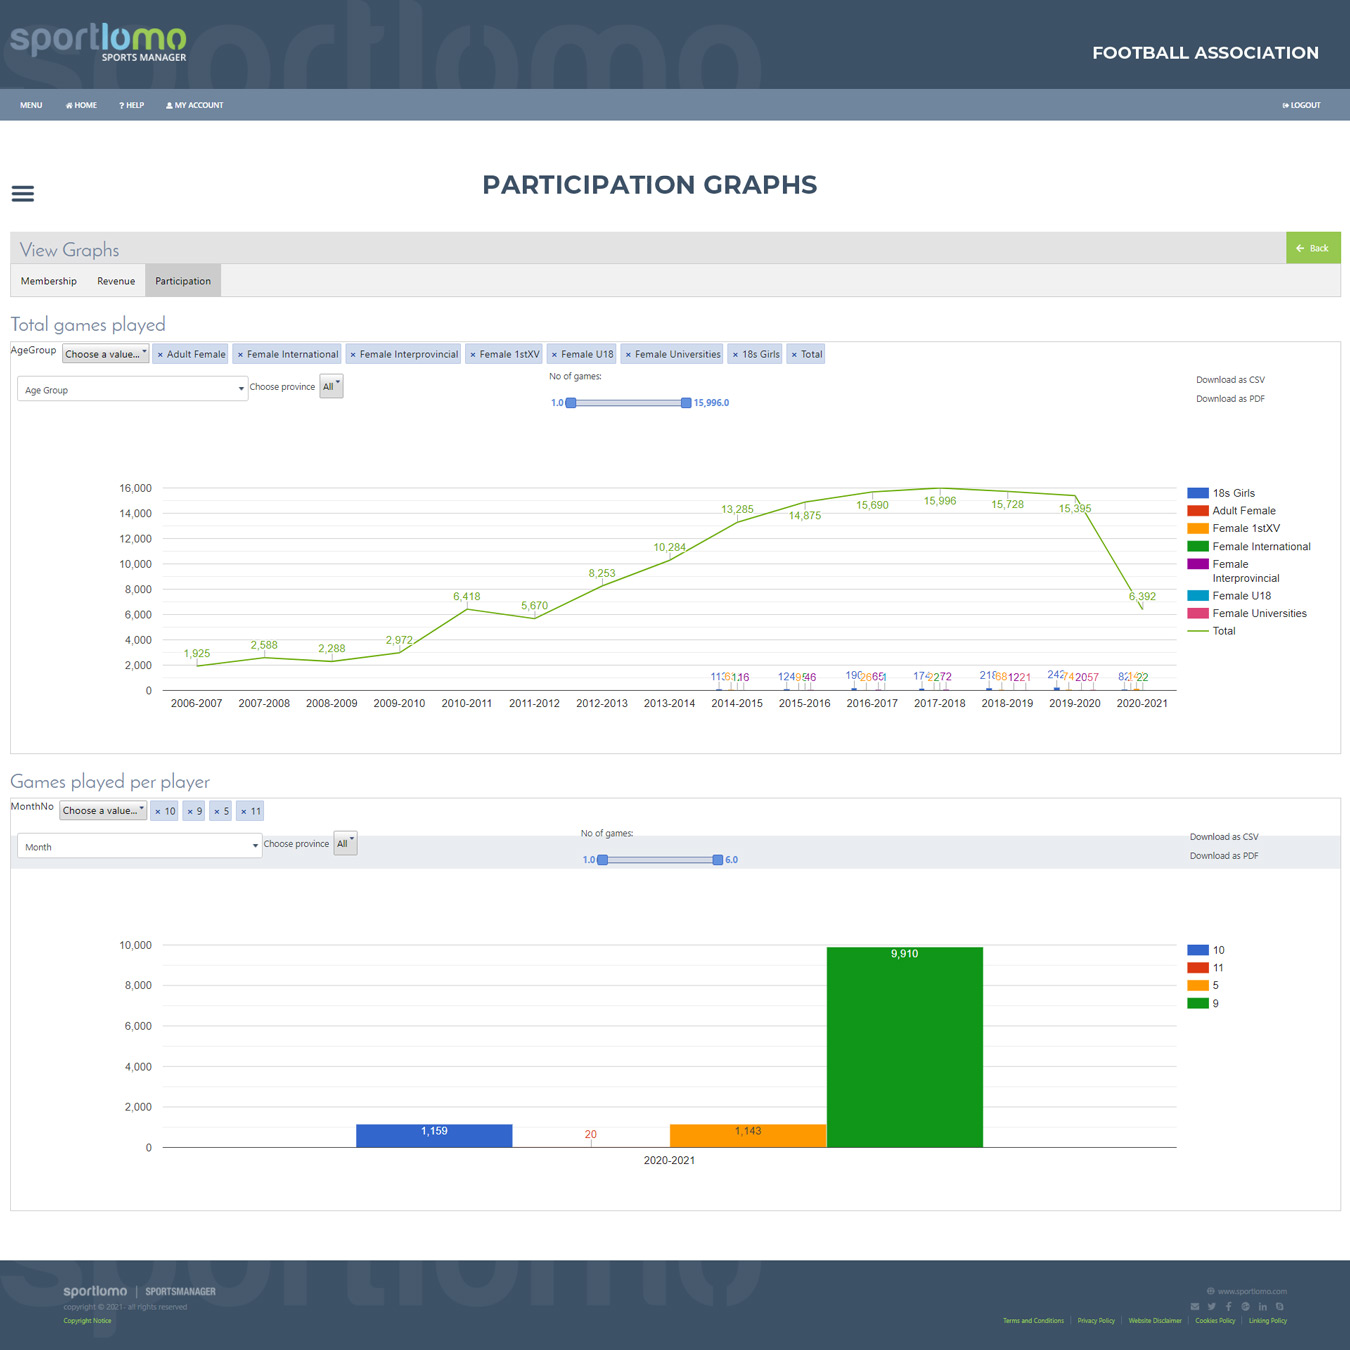
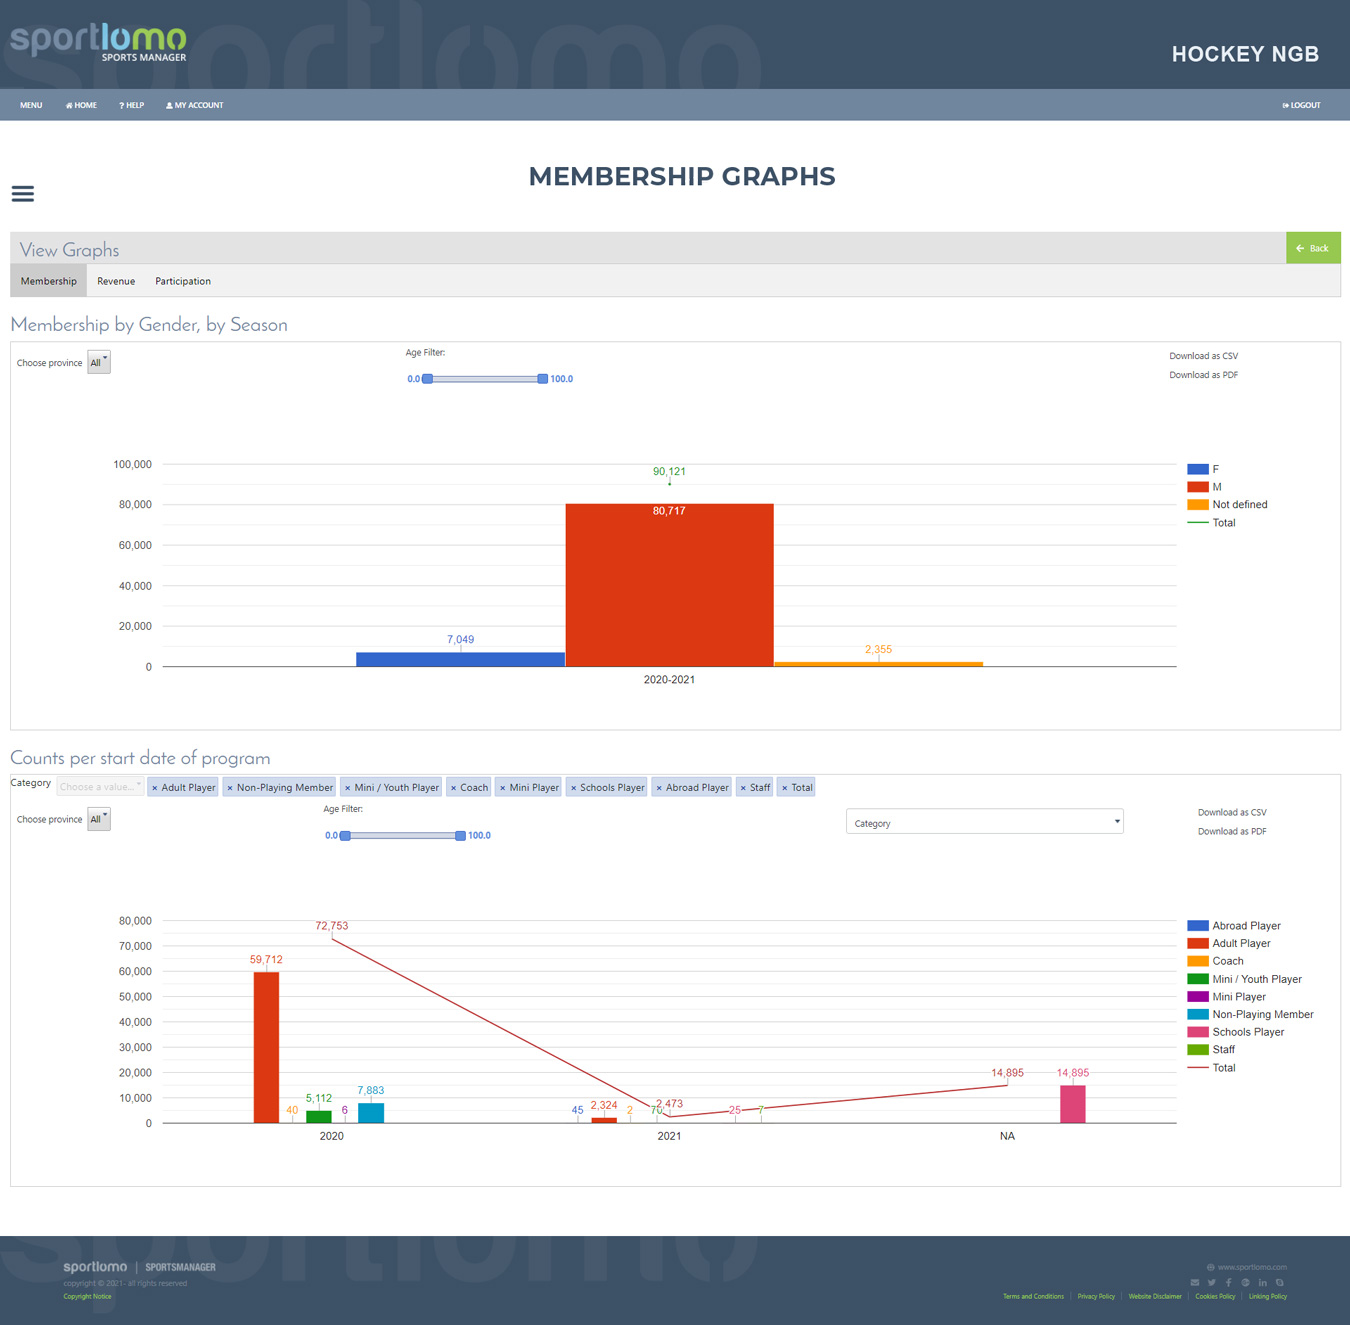
Understand your Participation, Membership and Revenues
Realtime business intelligence
In-platform Management Dashboard (graphical interface). Supports corporate performance management. Choose your own graphs / reports display.
New Management Dashboard
Create Custom Graphs to Report on Membership, Participation, Revenue
Business Intelligence, Graphs, Data Analytics and Insights
New Dashboard functionality is included in our most recent release. Create custom graphs to report on Membership, Participation and Revenues. Filter data and breakdown under member categories, events, status, players, participation, games, season, month/year, age, gender, ethnicity. This module is continuing to evolve.


